Transport Cost Estimator
Role: Frontend developer & UX/UI Designer
HTML | CSS | Vanilla JS | Figma
Introduction
Tourism New Zealand is an organisation with the prime task of marketing New Zealand and promoting it to be a top tourist destination globally. They research and target core markets and ensure that all visitors have a great experience. They partner with various organisations to ensure that people who visit New Zealand are provided with how to travel safely, places to visit, food and activities to try and how to respect and protect the local culture and environment.
Problem Statement
The COVID-19 pandemic has affected the Tourism immensely - with borders around the globe being closed for a few years. Since New Zealand has opened its borders once again, Tourism New Zealand is working hard to support the stakeholders in the Tourism industry. Their most recent campaign is still in line with the “100% Pure New Zealand” brand and is targeted towards short-stay tourists that arrange their own travel itineraries. It has been acknowledged that when people arrange their own trip, finding the information is often quite a tedious task as it involves visiting a lot of websites.
This project aims to simplify the process in terms of transport. It will focus on a single page web application integrated in the public website of Tourism NZ (newzealand.com/nz) that will provide potential visitors with the landing page when they get to the website then followed by asking them the number of people travelling, duration of their stay in the country and their estimated total driving distance in steps of 100kms. From the data provided, a range of options will be presented with some features of the vehicle and the estimated total cost of booking. Whenever the user clicks on the “view estimate” button for the selected vehicle, they will be directed to the cost calculation breakdown (rental + fuel) section. Afterwards they will be presented with the relevant links at the bottom to be able to book with the rental companies. For this project the minimum viable product will just be the single page application and the links to other pages will have placeholders temporarily until the page is ready to be added to the live website.
Research and Discovery
Secondary research was conducted to gather data regarding the Tourism industry in New Zealand, the target users of the web application and the likelihood of them to use it to estimate the cost of renting a vehicle in NZ for their intended travel plans. A similar method was used for the Competitor Analysis to understand the strengths and weaknesses of other web applications that provide a cost estimation of renting a vehicle. Secondary research was also utilised to validate the initial assumptions made. On the other hand, quantitative research such as online surveys were used to gather feedback on the low fidelity and high fidelity wireframes and the style tile.
Target Market
Tourism New Zealand is currently focusing their marketing strategies on short term visitors from their core markets - people who come from countries like Australia, USA, UK, China, Japan, Singapore, Canada. These people’s primary reason for travelling will be to go on a holiday and explore as much of New Zealand as they can. The median length of stay for all the visitors in New Zealand is 9.1 days.
Primary target market
The primary target market will be people who are aged between 25-64 who come from the countries mentioned above and have varying genders. These people would also be the ones staying in the country between 4 to 14 days. The selection was based on the data provided by Statistics New Zealand on the key characteristics of NZ visitors.
Secondary target market
The secondary target market will be people from all countries and have all genders that are aged 24 and under and 65 and above. The number of people who are within this age range are still a lot but not as high as the age range of the primary target market. These people will have varying lengths of stay from 1 to 3 days or 15+ days.
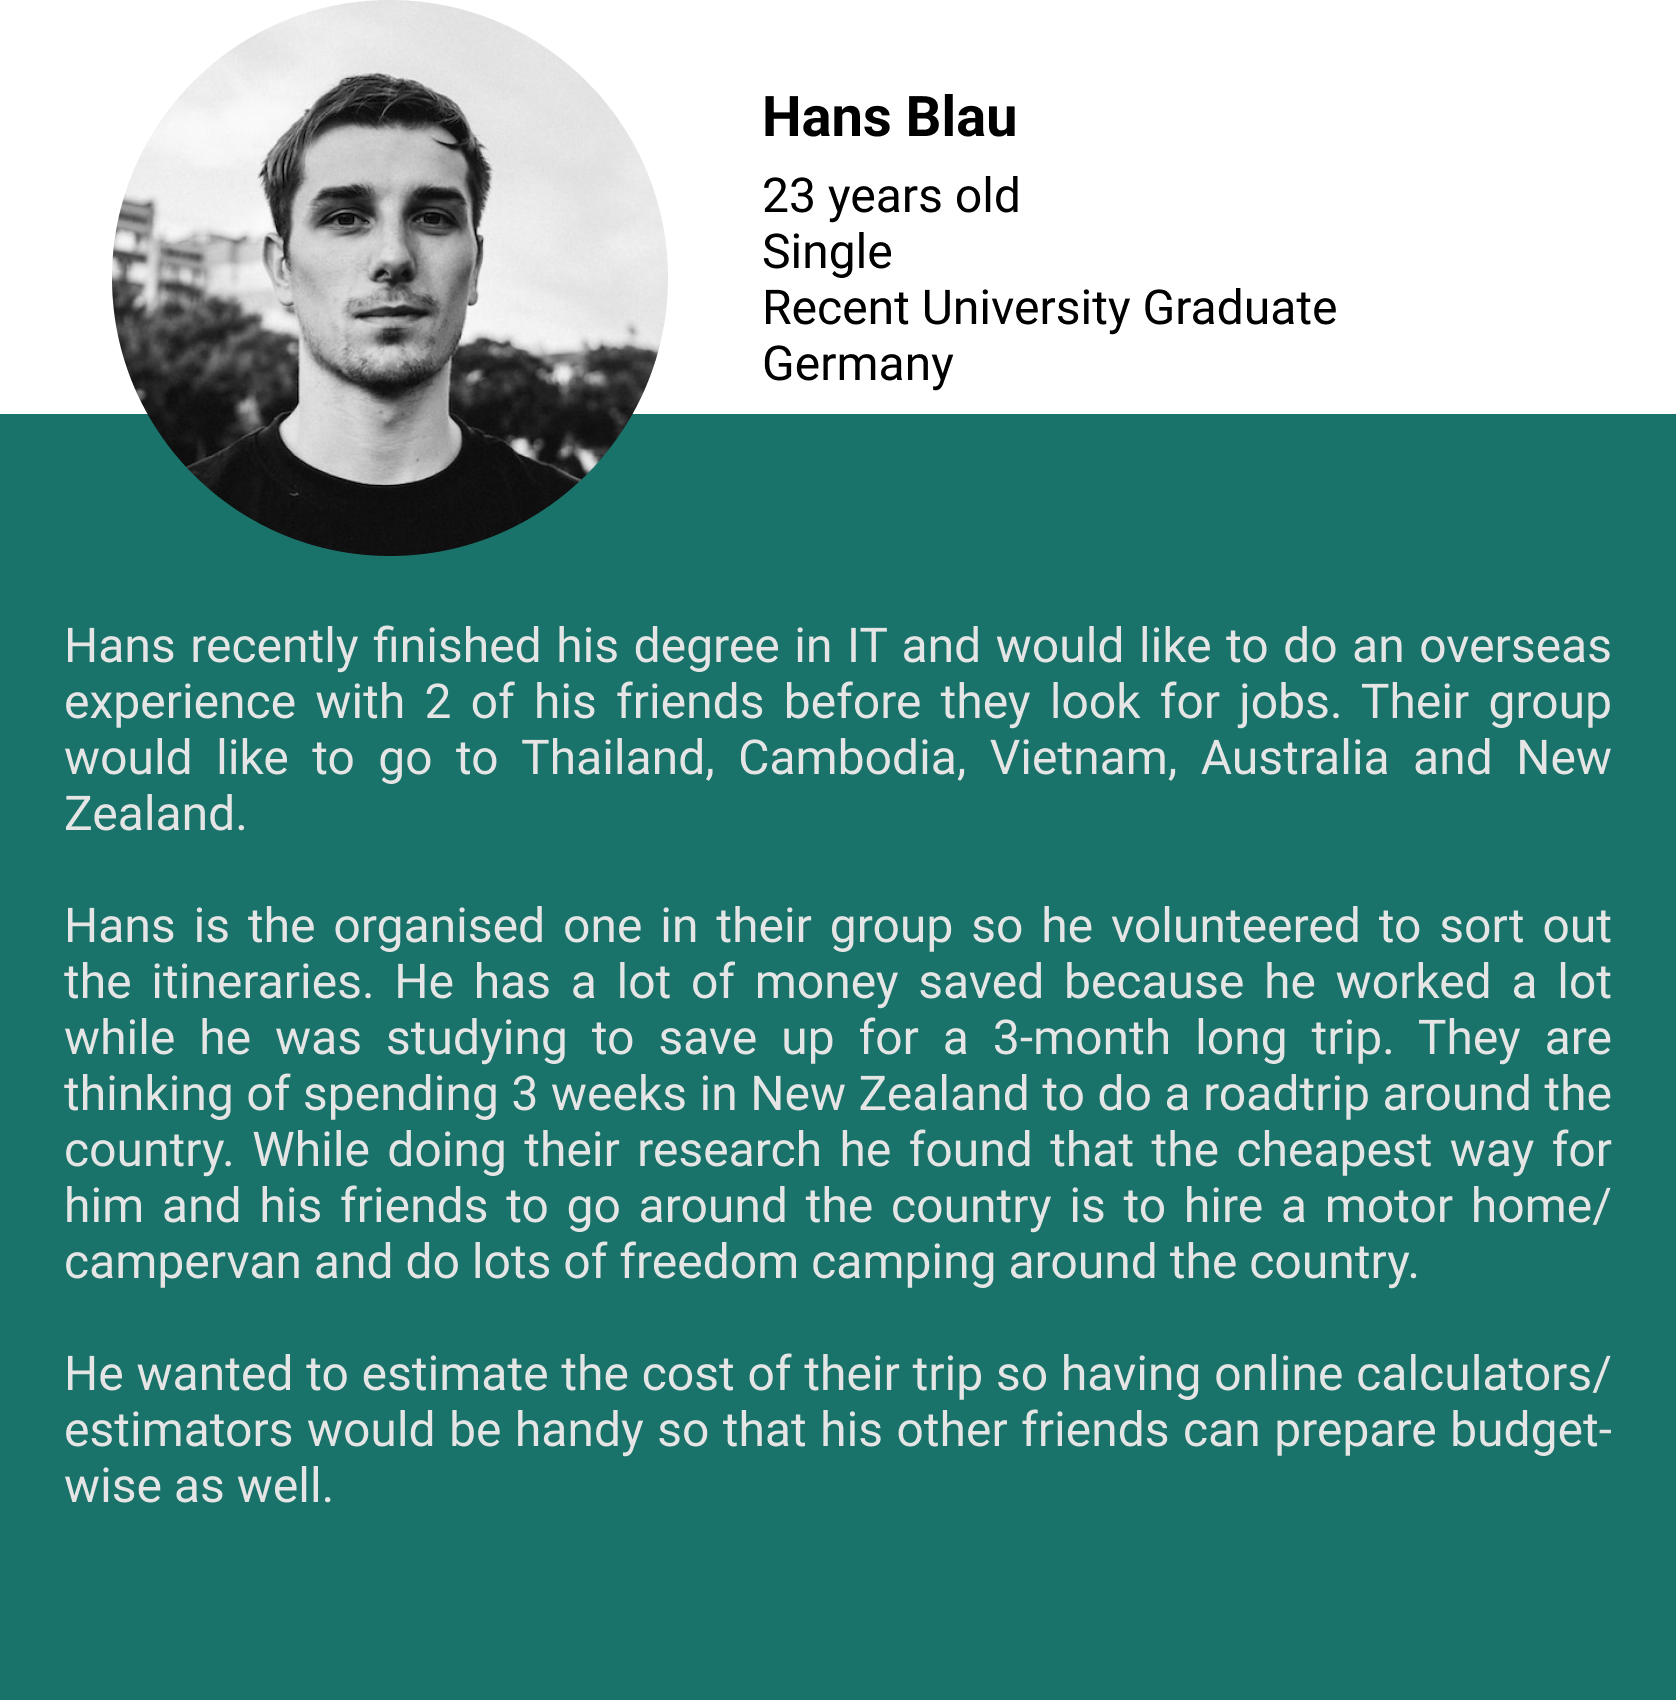
User Personas
In order to create a user-centered design, I have identified two key user personas that represent the target market:

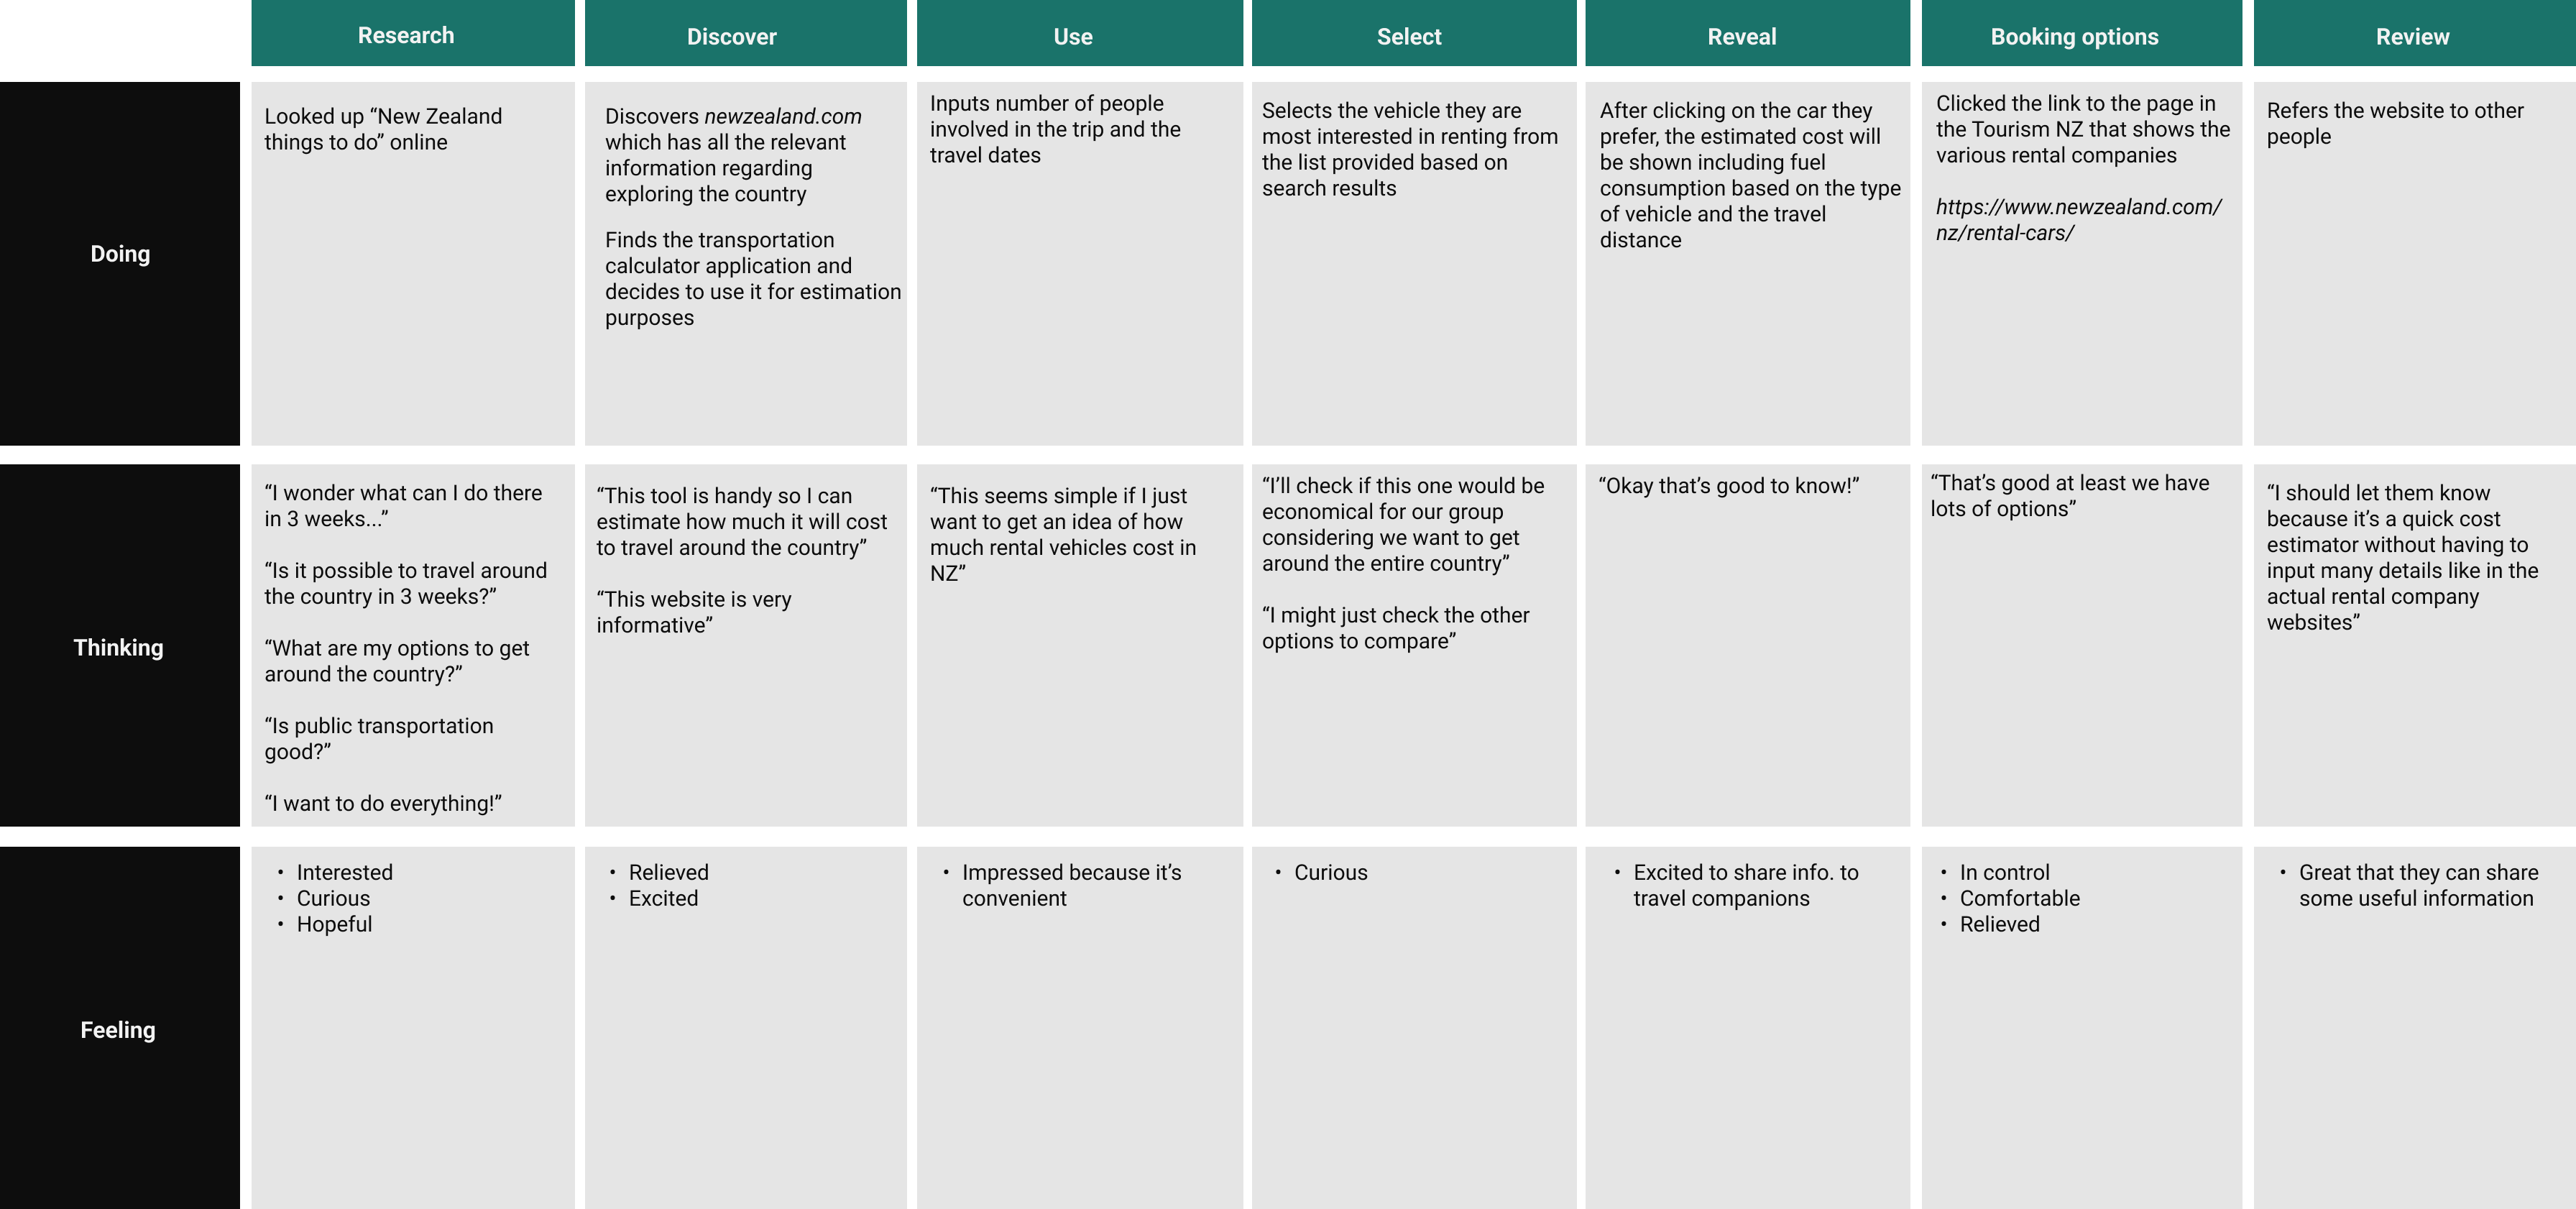
User Journey
This map shows the ideal journey a customer takes to discover and use the transportation calculator application provided by Tourism NZ.
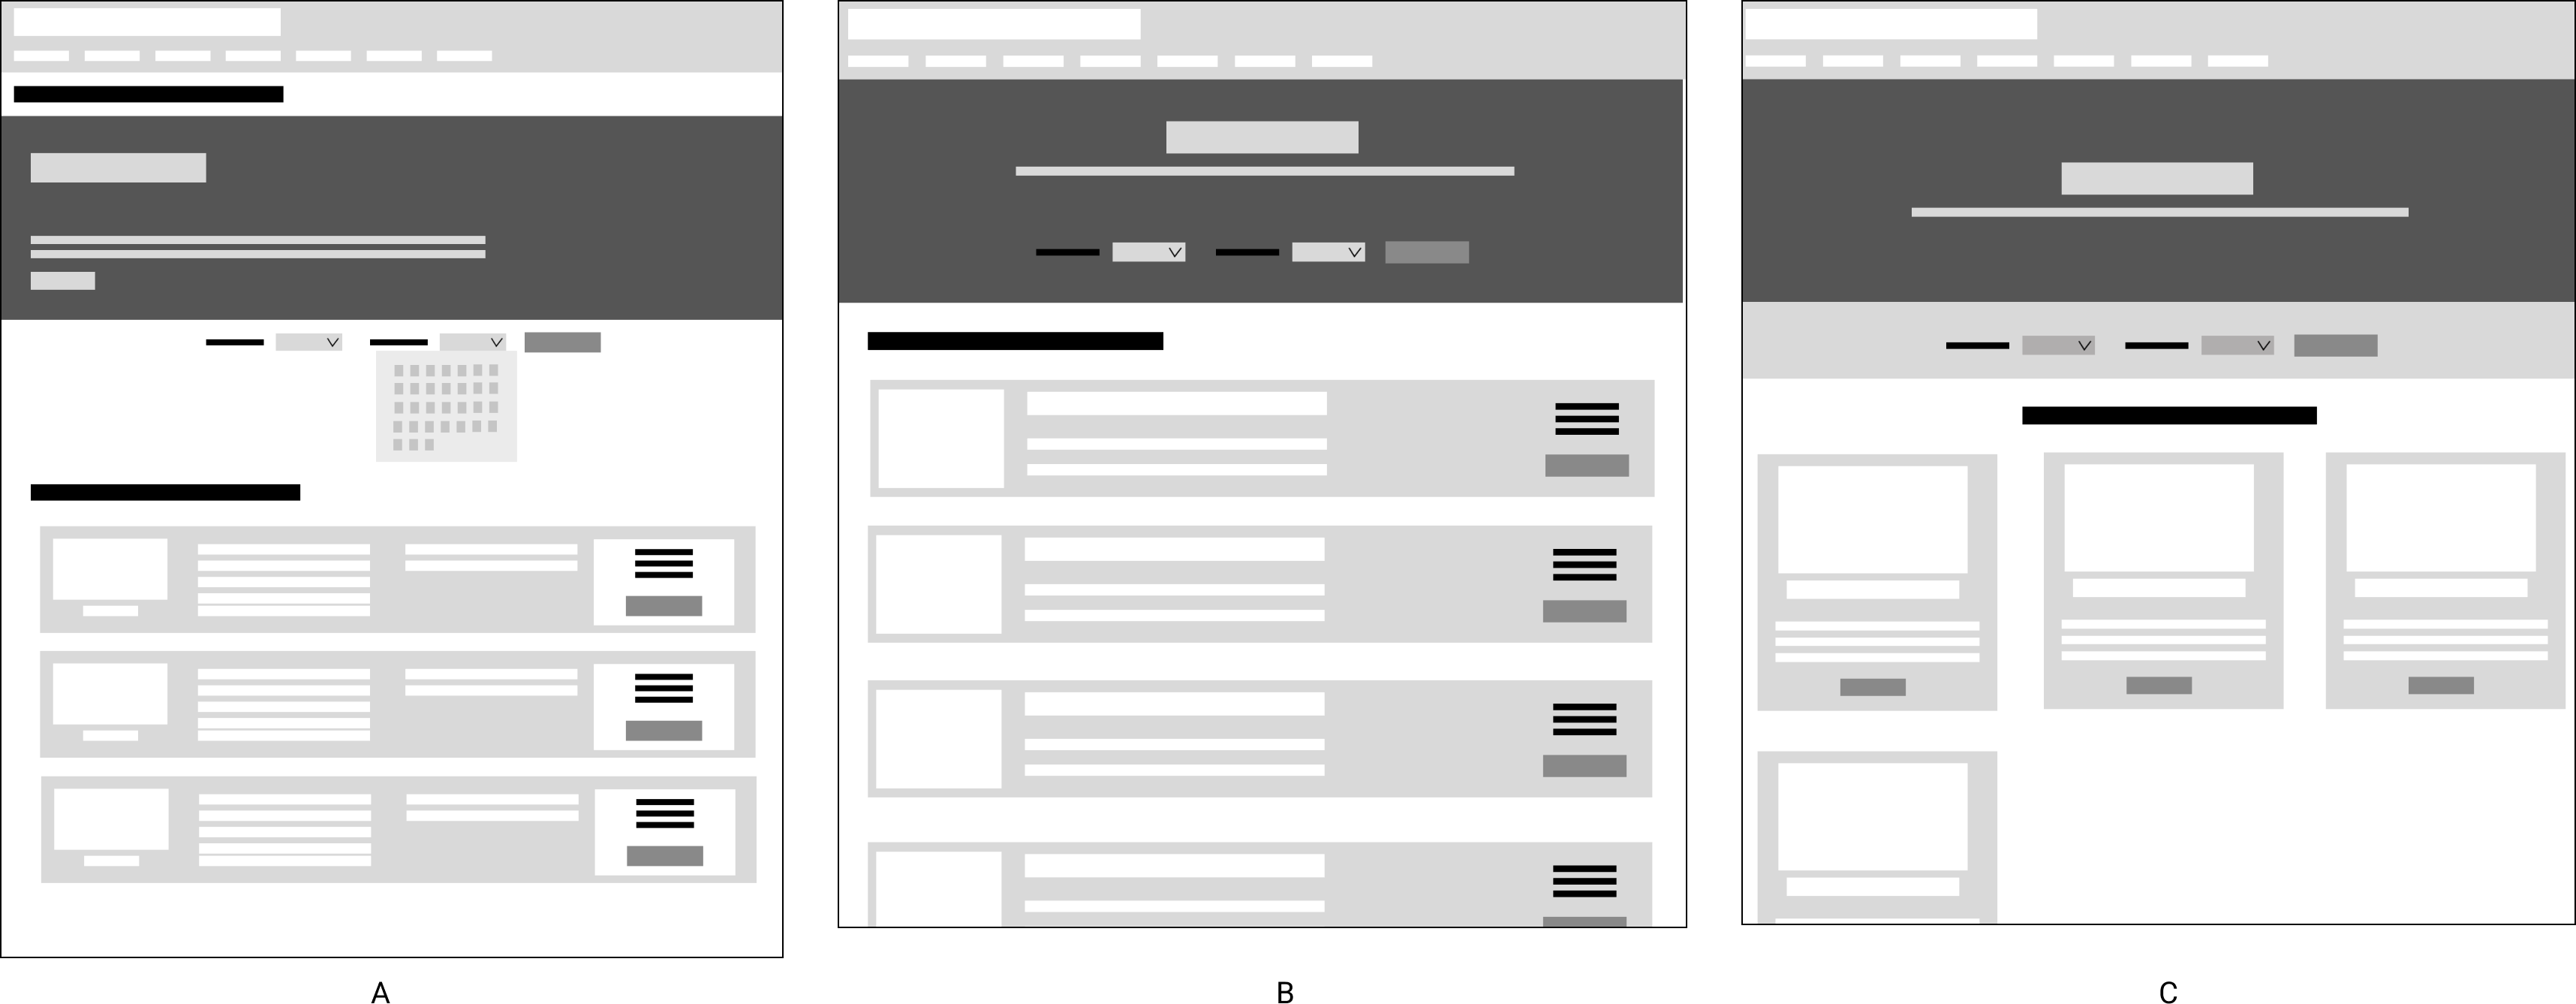
Low Fidelity Wireframes
These were the design options created for desktops and larger screens. User testing was conducted to determine which design appealed the most to potential users.
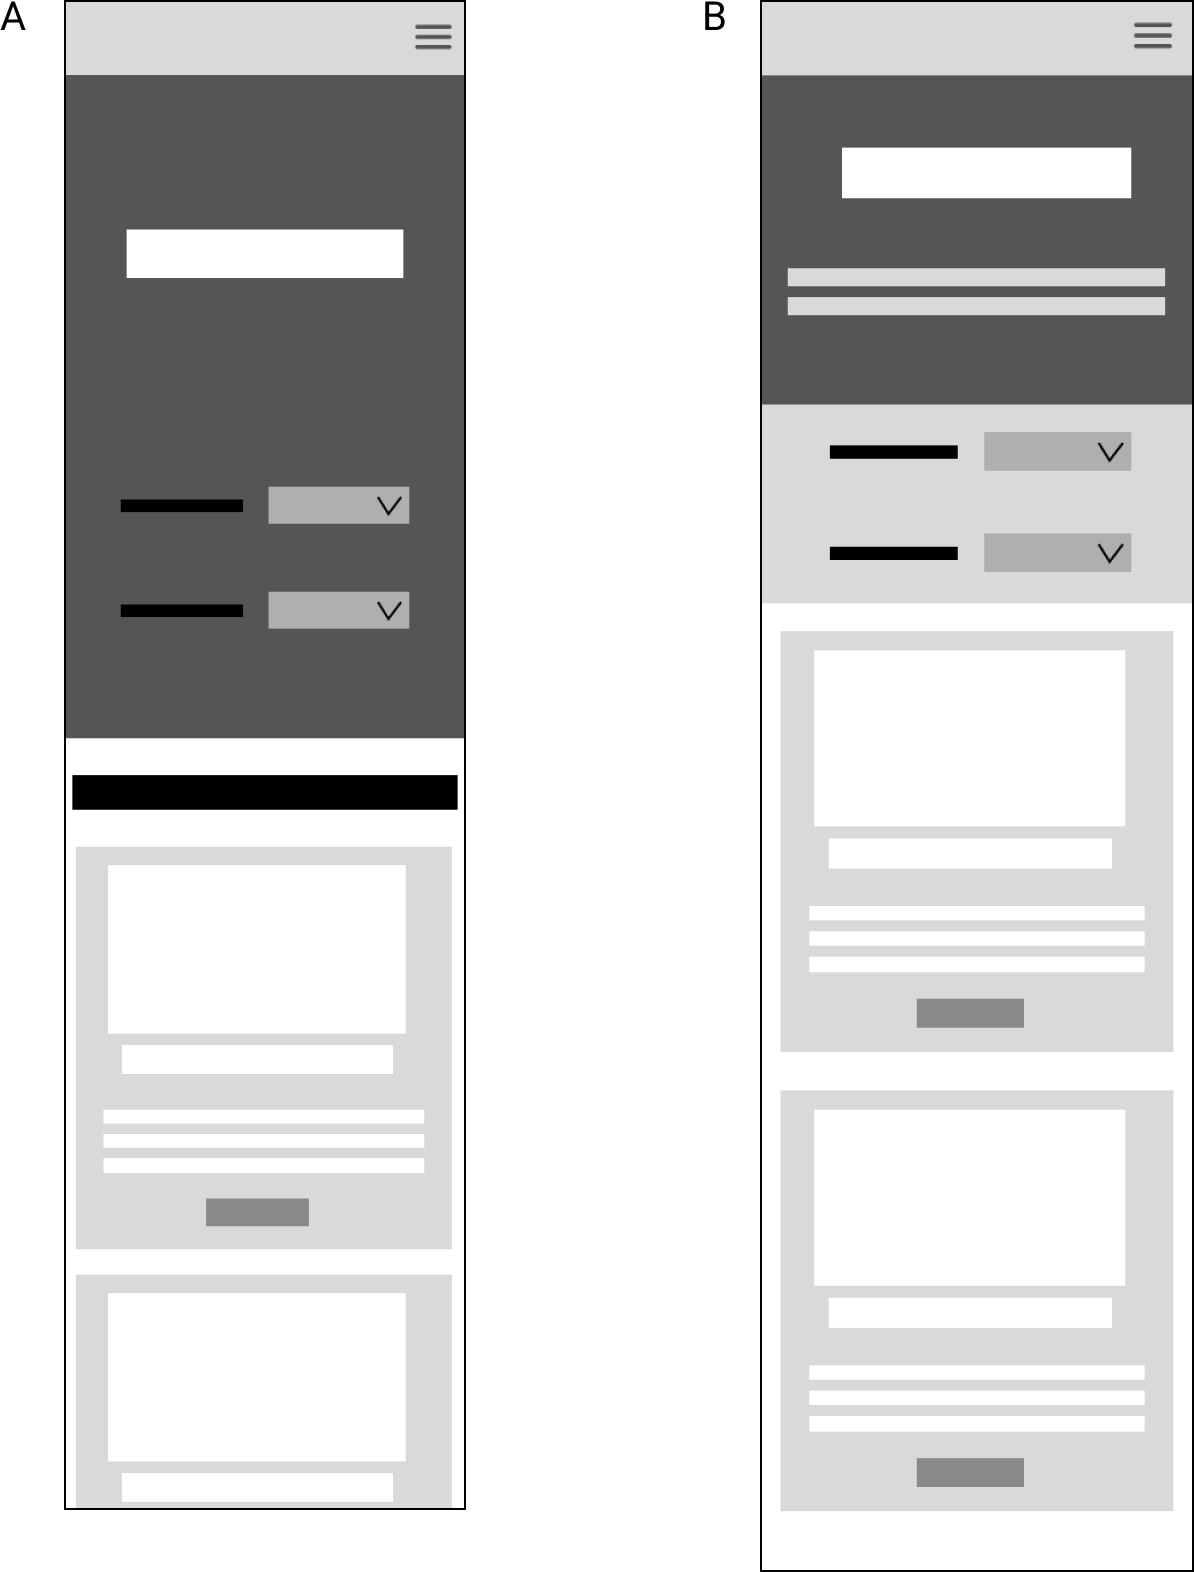
These were the design options created for mobile phone and tablet screens. User testing was conducted to determine which design appealed the most to potential users.
Below are the survey questions and the responses provided by the users from the target market

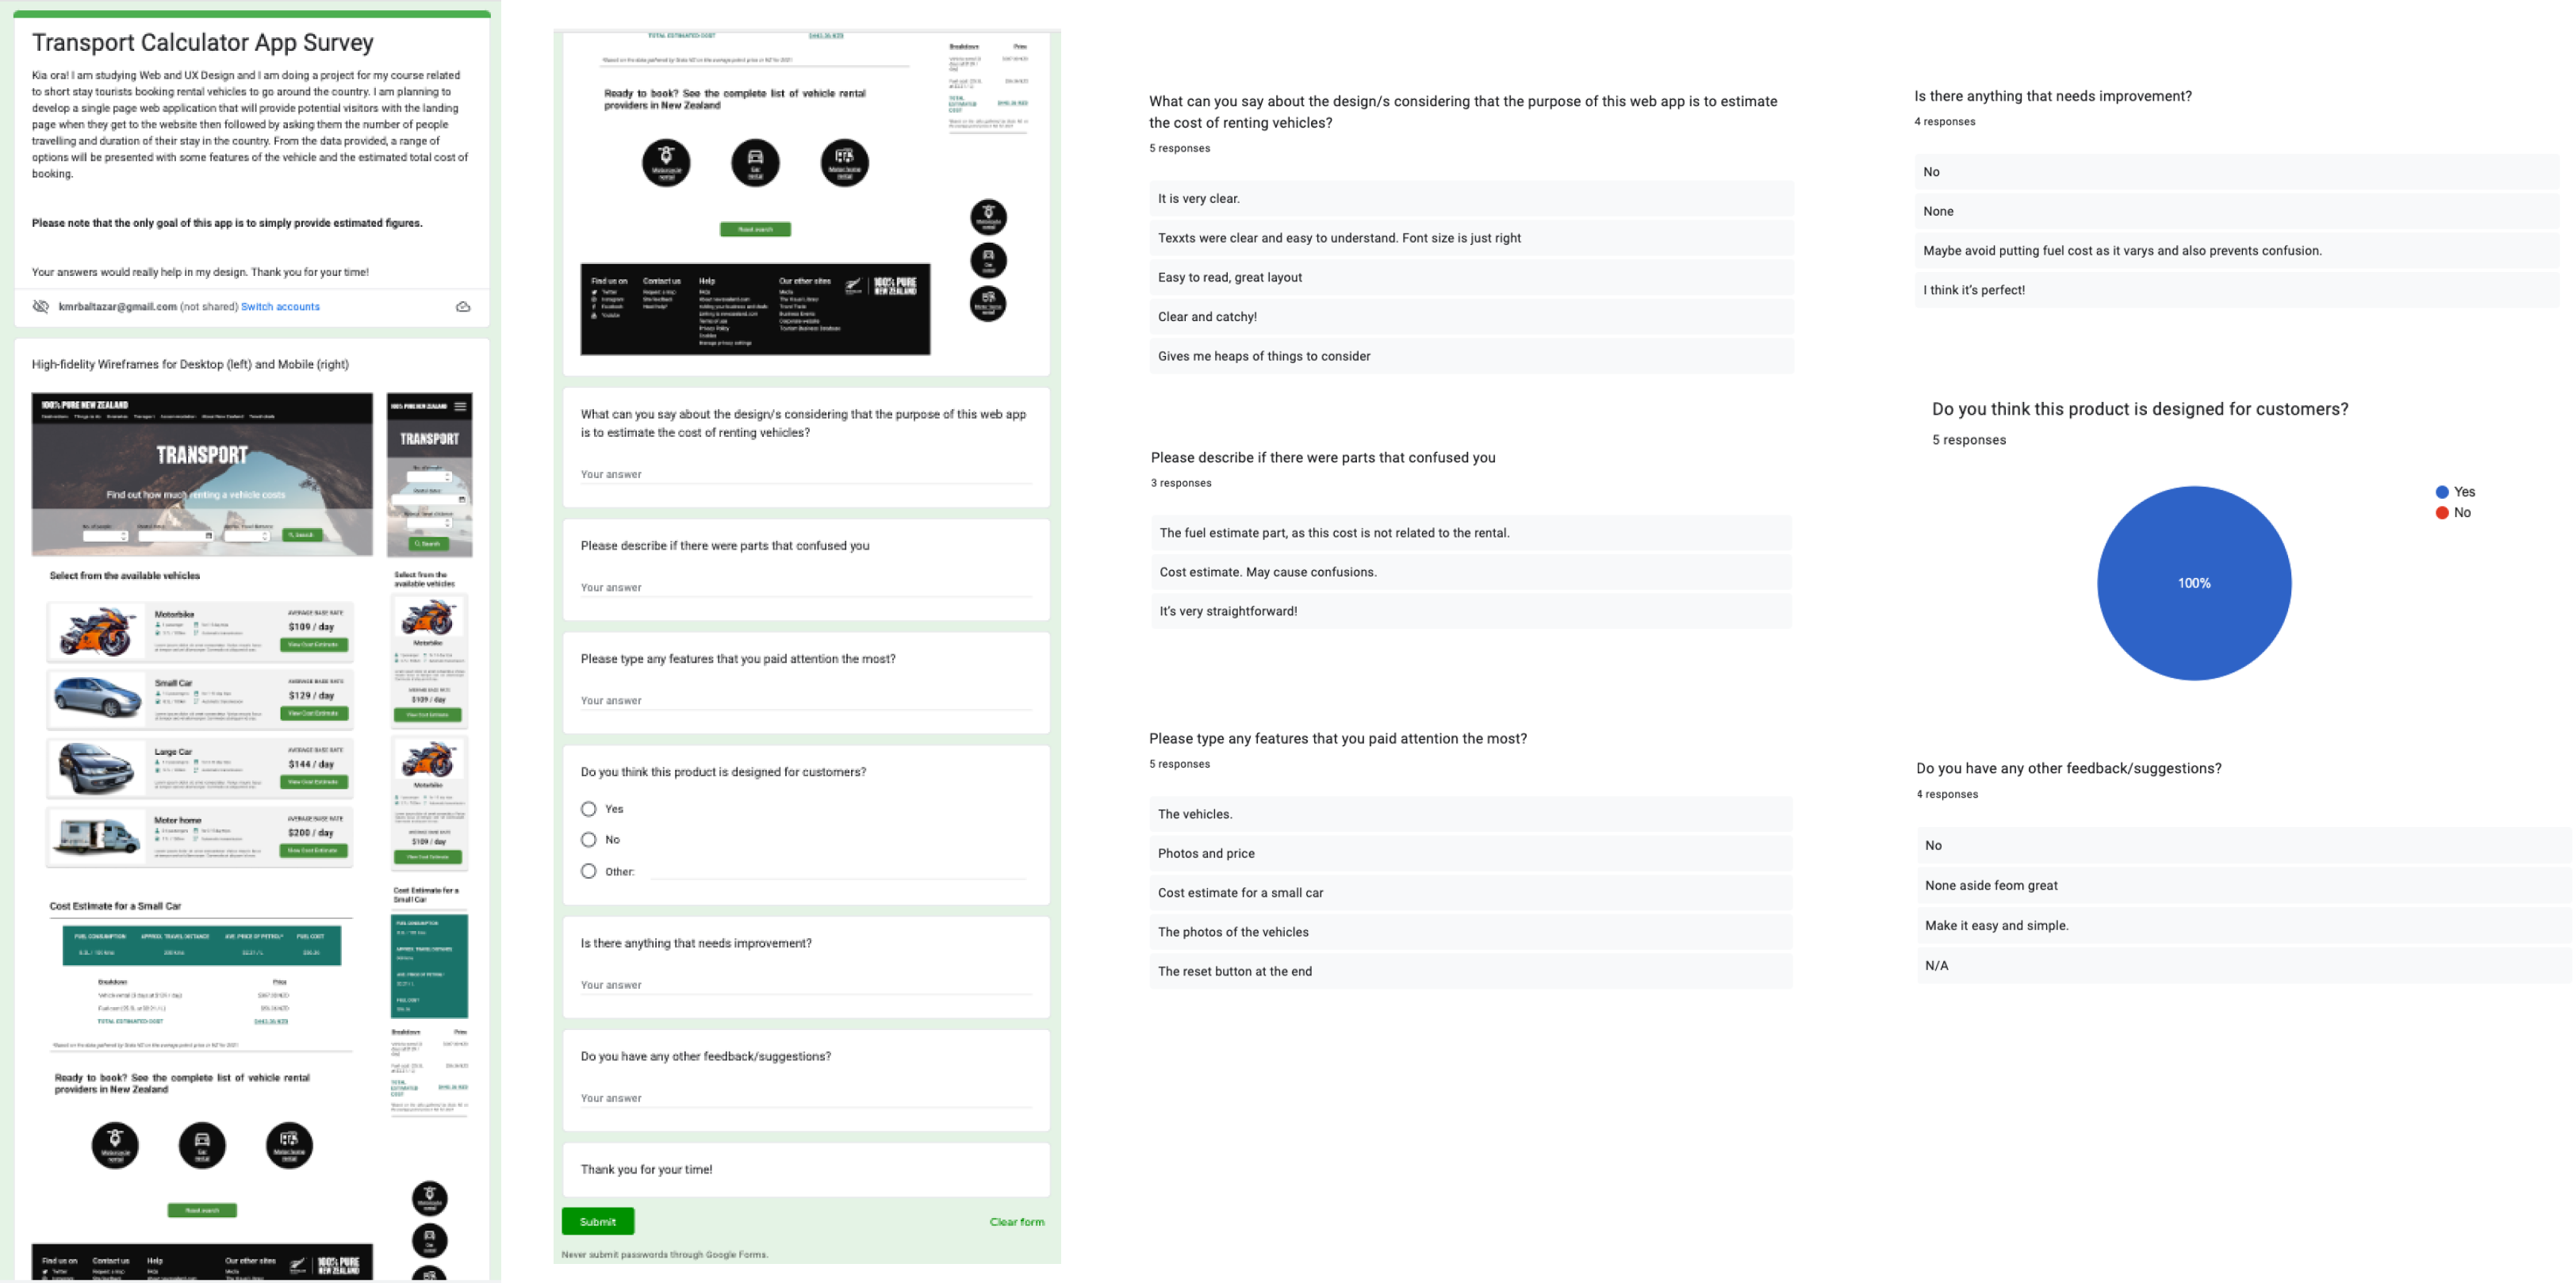
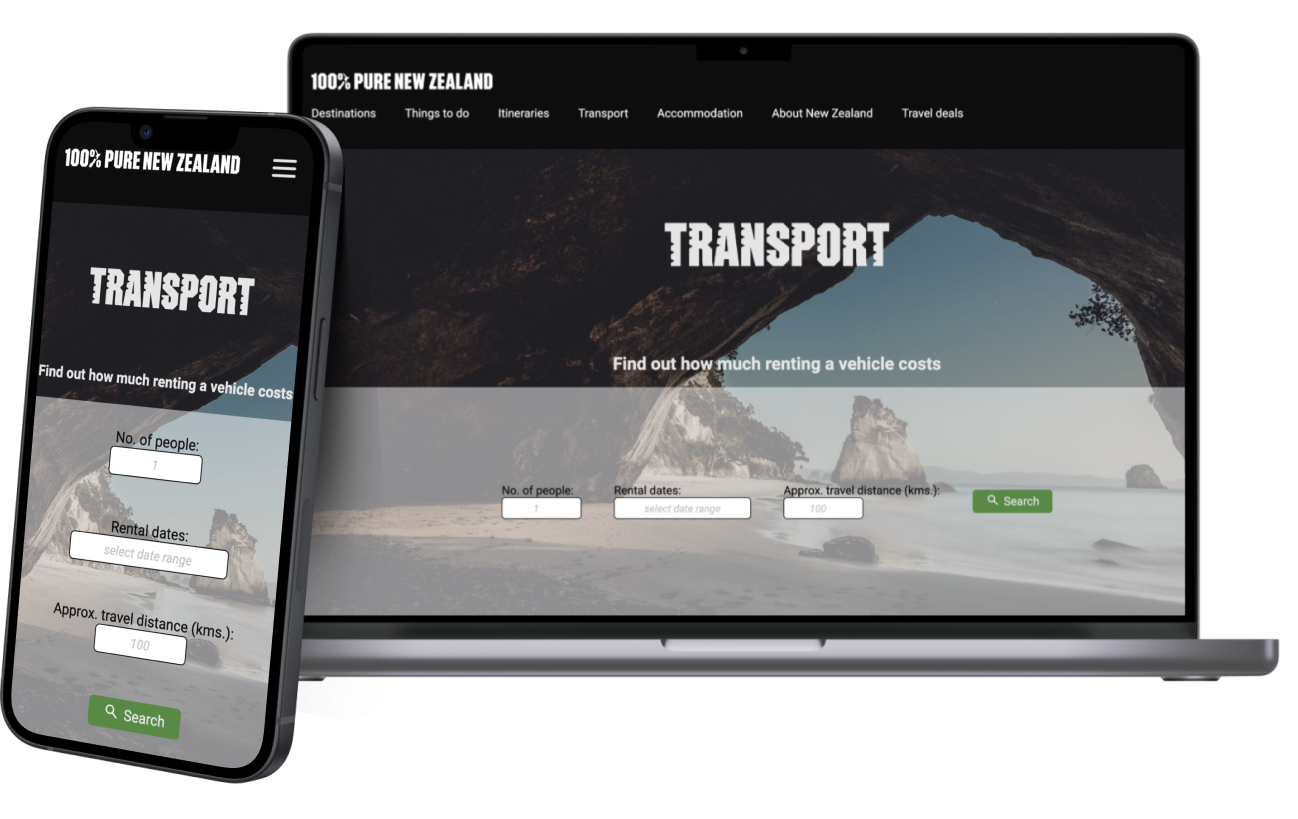
High Fidelity Wireframes
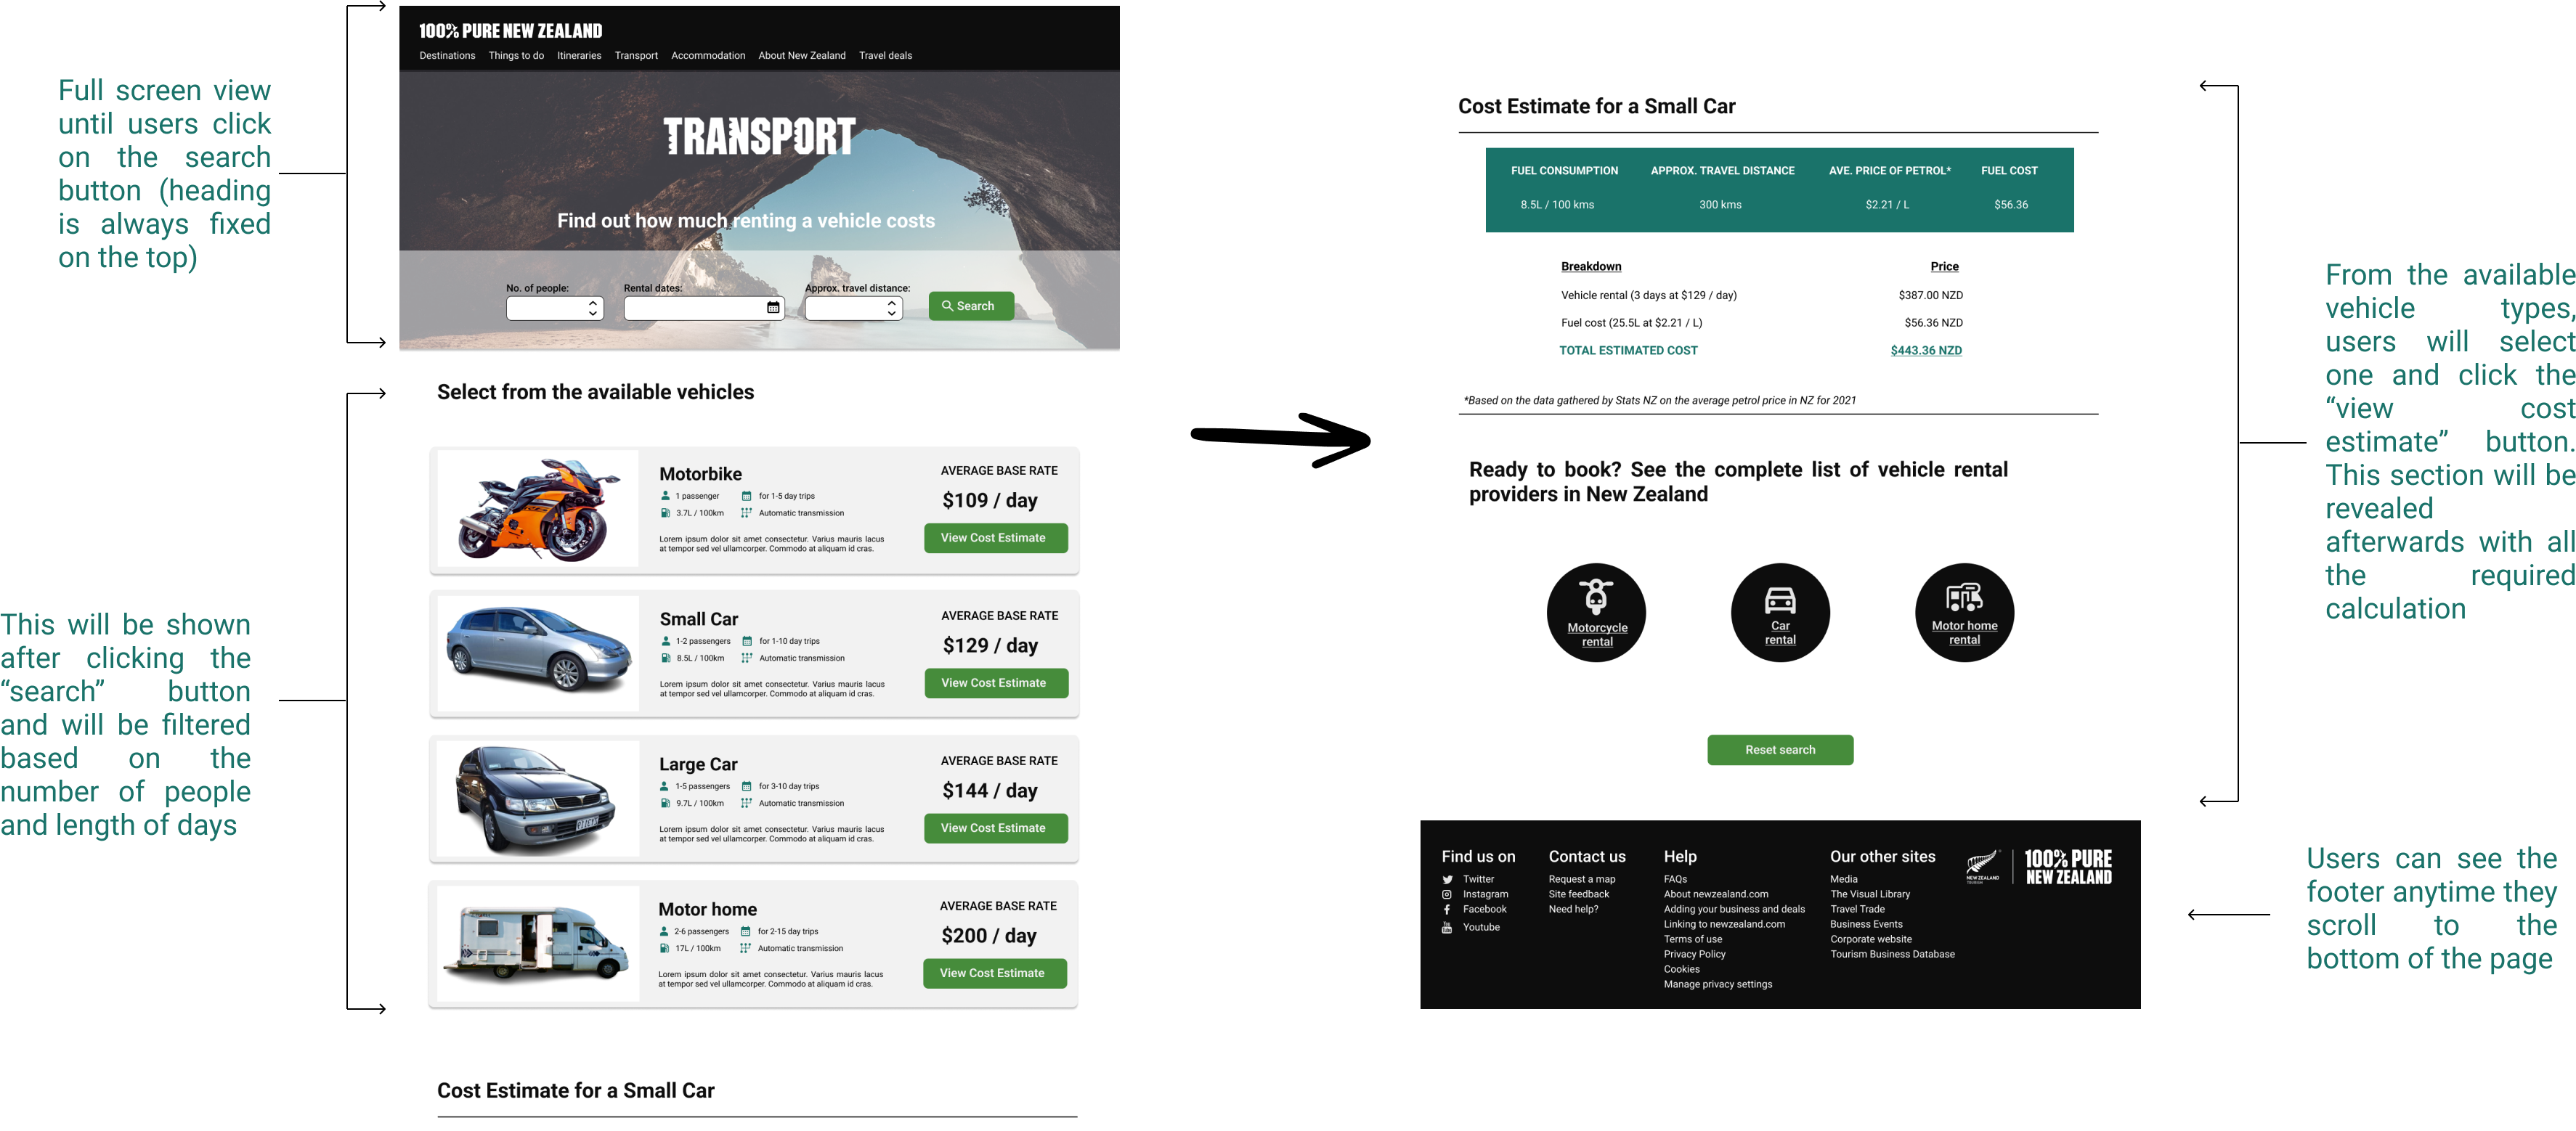
These were the design options created for desktops and larger screens. User testing was conducted to determine which design appealed the most to potential users.
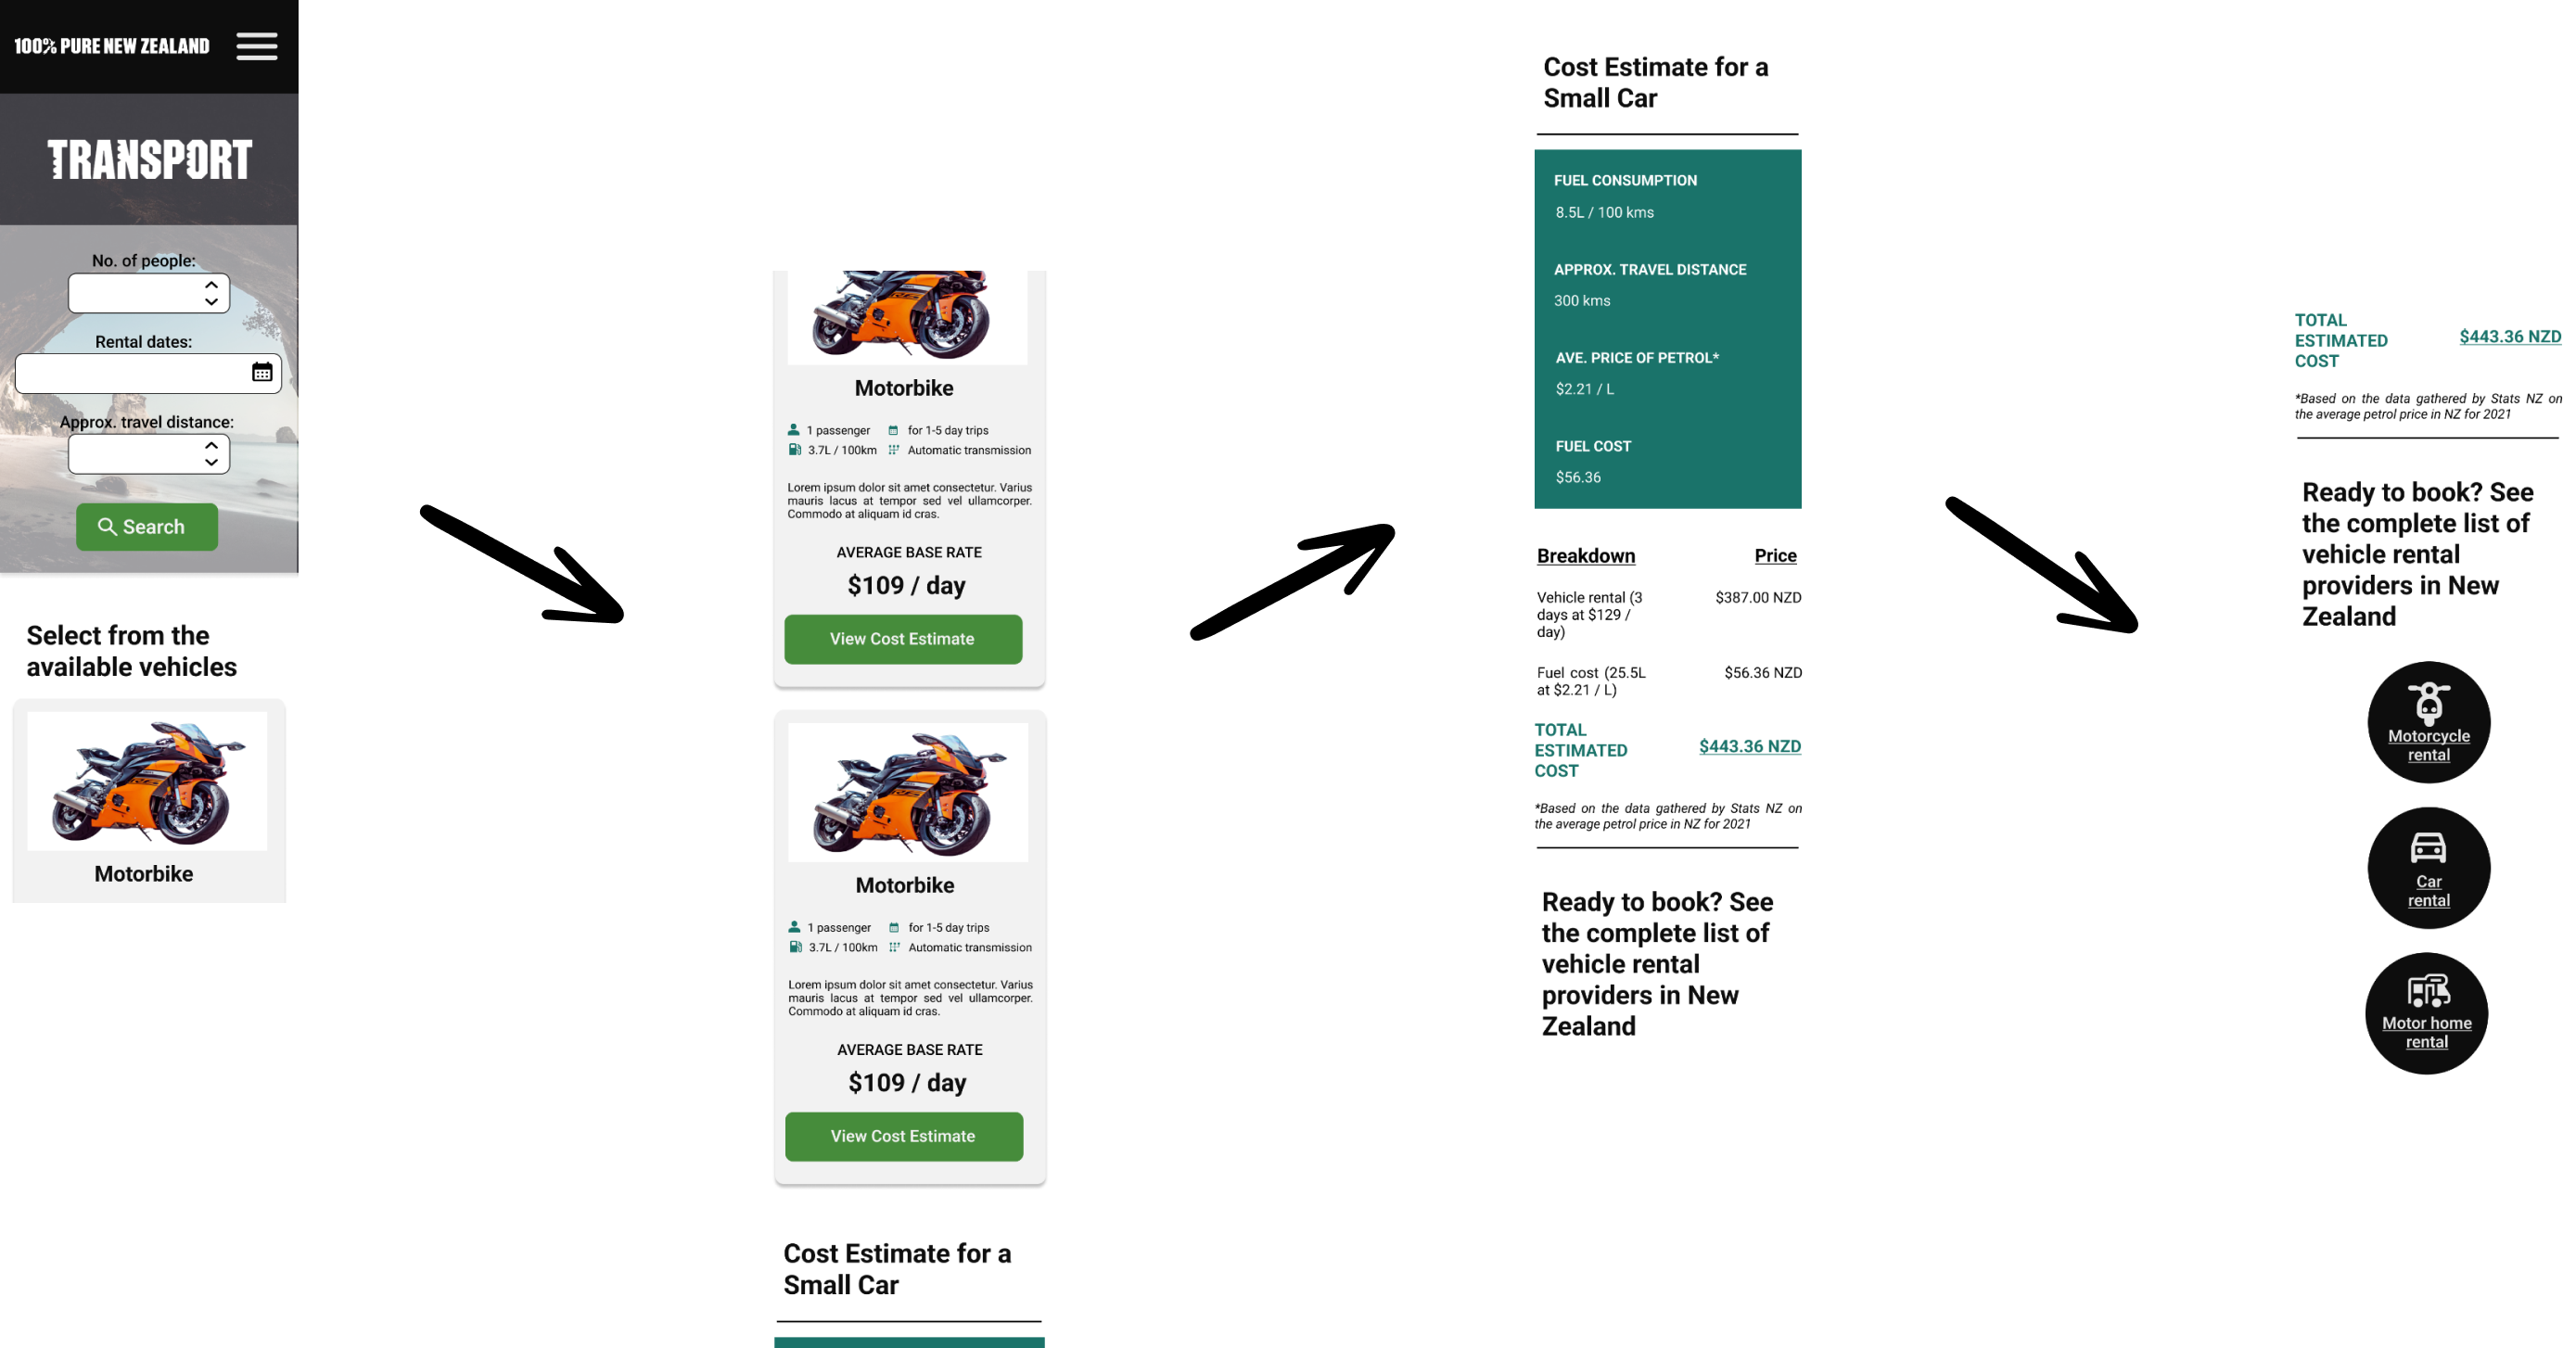
These were the design options created for mobile phone and tablet screens. User testing was conducted to determine which design appealed the most to potential users. Please note that the mobile and desktop views have the same specifications - the content will only be compressed to fit the screen width of tablets and mobile phones
Below are the survey questions and the responses provided by the users from the target market